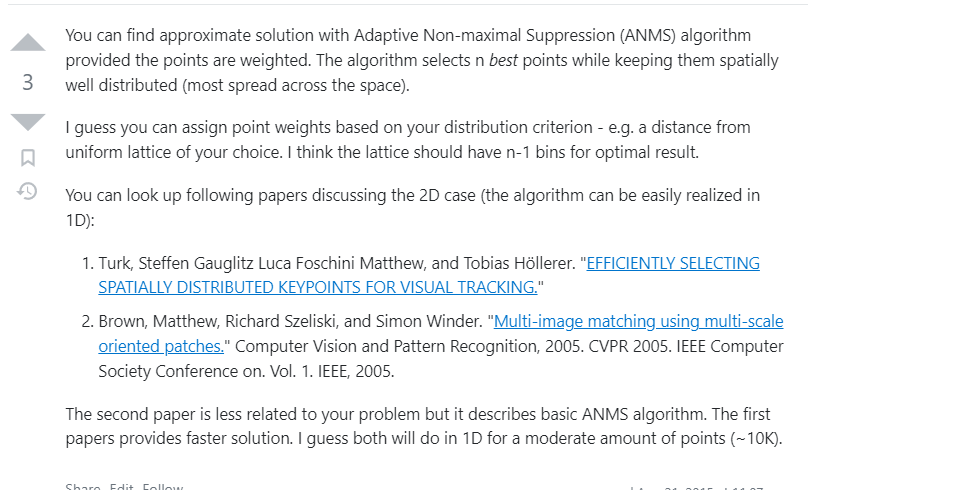
EFFICIENTLY SELECTING SPATIALLY DISTRIBUTED KEYPOINTS FOR VISUAL TRACKING 2011
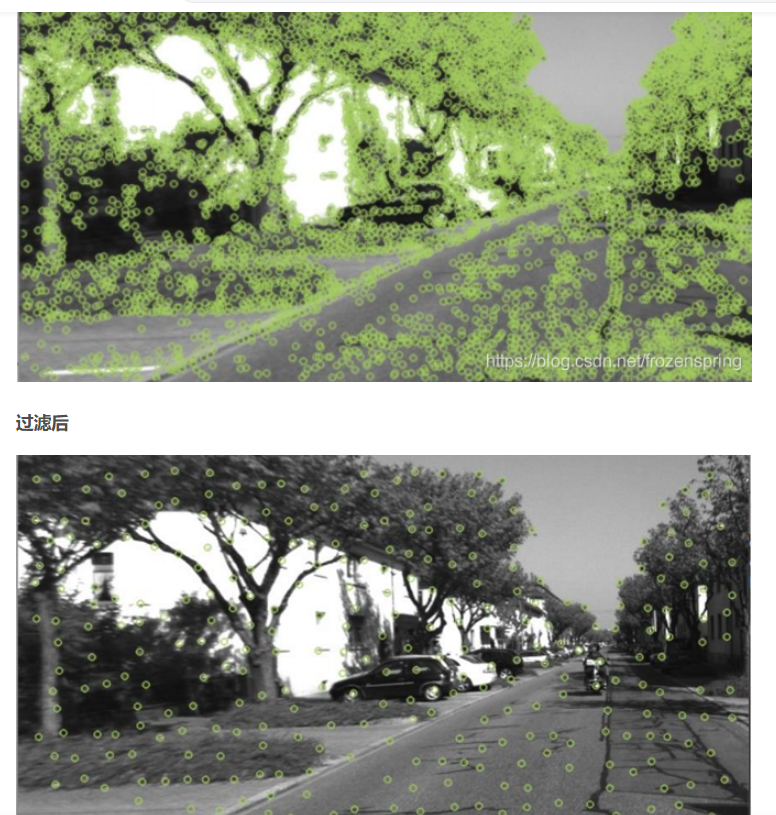
2005年 Matthew Brown在论文Multi-Image Matching using Multi-Scale Oriented Patches提出了自适应非极大值抑制算法(Adaptive Non-Maximum Suppression,ANMS
最近有一篇论文讨论了图像上均匀关键点分布的问题。这个资源库提供了 C + + 、 Python 和 Matlab 接口
There is a recent paper that tackles the problem of homogeneous keypoint distribution on the image. C++, Python, and Matlab interfaces are provided in this repository
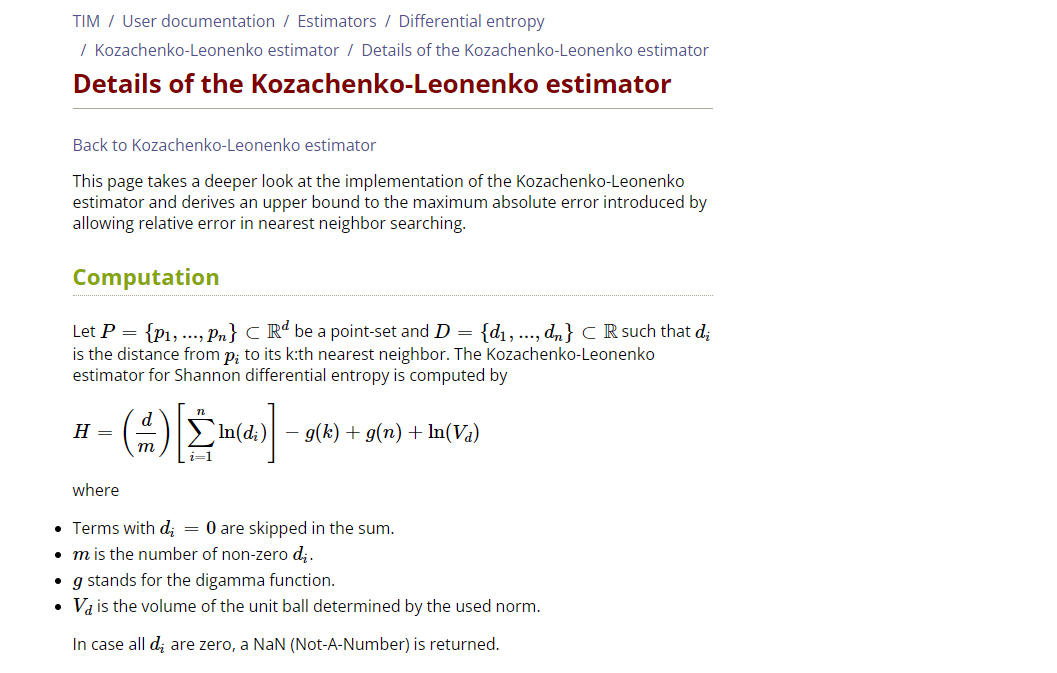
L. F. Kozachenko and N. N. Leonenko. Sample estimate of entropy of a random vector. Problems of Information Transmission, 23:95–101, 1987.
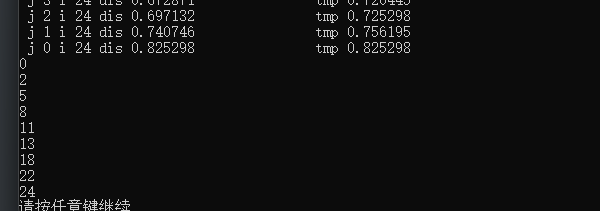
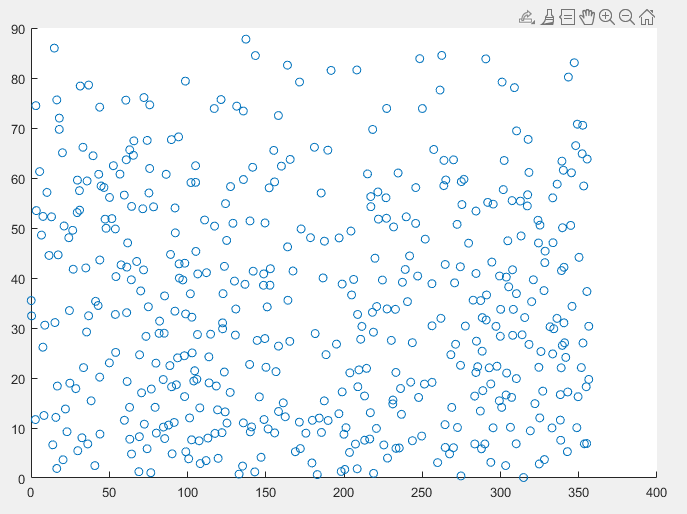
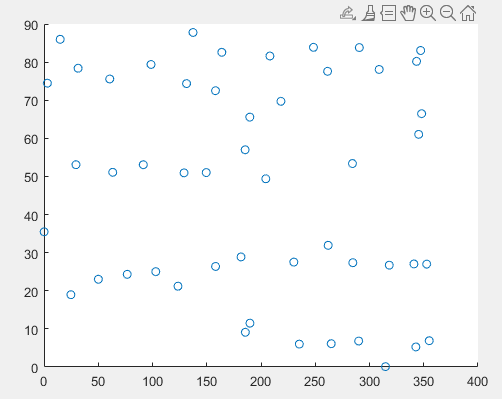
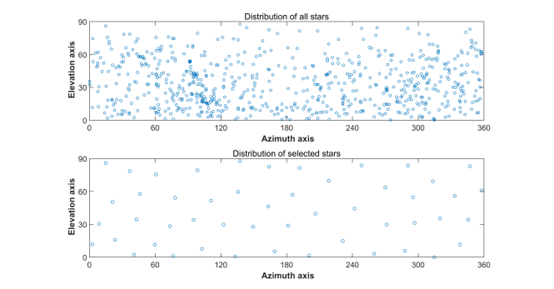
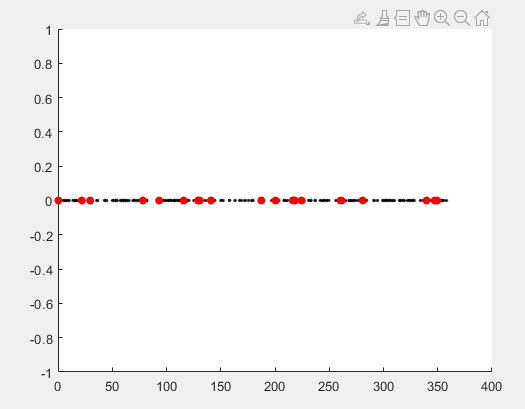
clear all;  close all;clc;
% tic
% load points;
M = csvread('J2000_5_hor.csv');
points = M(:, 2:3);
% points = sortrows(points,1);
rng('shuffle')  % 控制随机数的生成,否则每次打开matlab得到的结果都一样
len = 50;
%%
jiange = 5;
x = 0;
y = 0;
ret = [];

while x < 360 && y < 90
    tmp = find( (points(:,1)> x) & (points(:,2) >y) & (points(:,1)<= x+ jiange) & (points(:,2)<= y+ jiange) );
    if ( ~isempty(tmp) )
        ret = [ret; points(tmp(1),:)];
    end
    y = y + jiange;
    if ( y >= 90 )
        y = 0;
        x = x + jiange;
    end
end
% scatter(points(:,1), points(:,2));
scatter(ret(:,1), ret(:,2));
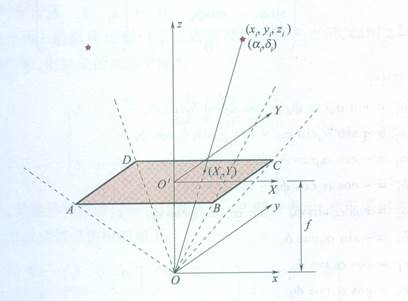
选自 Vedder, J. D., STAR TRACKERS, STAR CATALOGS, AND ATTITUDE DETERMINATION - PROBABILISTIC ASPECTS OF SYSTEM-DESIGN. J. Guid. Control Dyn.1993, 16, (3), 498-504.
clear all;  close all;clc;
tic
% load points;
M = csvread('J2000_5_hor.csv');
points = M(:, 2:3);
% points = sortrows(points,1);
rng('shuffle')  % 控制随机数的生成,否则每次打开matlab得到的结果都一样
len = 50;
%%
% jiange = 26.6;
left = 0;
right = 90;

while left < right
    ret = [];
    x = 0;
    y = 0;
    jiange = double( left + right ) / 2
    while x < 360 && y < 90
        tmp = find( (points(:,1)> x) & (points(:,2) >y) & (points(:,1)<= x+ jiange) & (points(:,2)<= y+ jiange) );
        if ( ~isempty(tmp) )
    %         ret = [ret; points(tmp(1),:)];
                ret = [ret; tmp(1)];
        end
        y = y + jiange;
        if ( y >= 90 )
            y = 0;
            x = x + jiange;
        end
    end
    length(ret)
    if (length(ret) == 50 )
        break;
    elseif ( length(ret) > 50 )
        left = jiange;
    else
        right = jiange;
    end
end
toc;
% scatter(points(:,1), points(:,2));
% scatter(ret(:,1), ret(:,2));
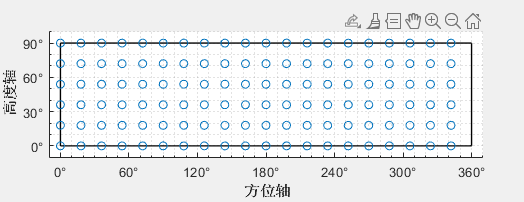
clear all;  close all;clc;
tic
jiange = 22.5;
ret = [];
x = 0;
y = 0;
while x < 360 && y <= 90
    ret = [ret; x, y];

    y = y + jiange;
    if ( y > 90 )
        y = 0;
        x = x + jiange;
    end
end
toc;
3个图拼一起
figure(1)
jiange = 30;
ret = [];
x = 0;
y = 0;
while x < 360 && y <= 90
    ret = [ret; x, y];

    y = y + jiange;
    if ( y > 90 )
        y = 0;
        x = x + jiange;
    end
end
jiange = 22.5;
ret1 = [];
x = 0;
y = 0;
while x < 360 && y <= 90
    ret1 = [ret1; x, y];

    y = y + jiange;
    if ( y > 90 )
        y = 0;
        x = x + jiange;
    end
end
jiange = 18;
ret2 = [];
x = 0;
y = 0;
while x < 360 && y <= 90
    ret2 = [ret2; x, y];

    y = y + jiange;
    if ( y > 90 )
        y = 0;
        x = x + jiange;
    end
end
subplot(3,1,2)
xt=get(gca,'xtick'); for k=1:numel(xt); xt1{k}=sprintf('%d°',xt(k)); end set(gca,'xticklabel',xt1); yt=get(gca,'ytick'); for k=1:numel(yt); yt1{k}=sprintf('%d°',yt(k)); end set(gca,'yticklabel',yt1);
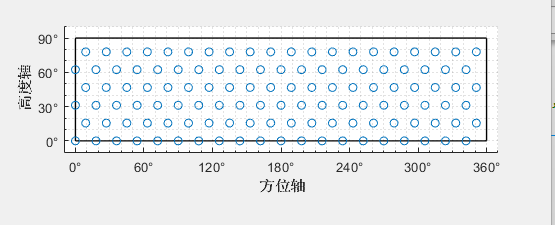
clear all;  close all;clc;
jiange = 22.5;
ret = [];
x = 0;
y = 0;
while x < 360 && y <= 90
	if x >= 0
	    ret = [ret; x, y];
 	end
    x = x + jiange;
    if ( x >= 360 )
        x = x - 360 -jiange/2.0;
        y = y + jiange/2.0*sqrt(3);
    end
end
存在这种情况
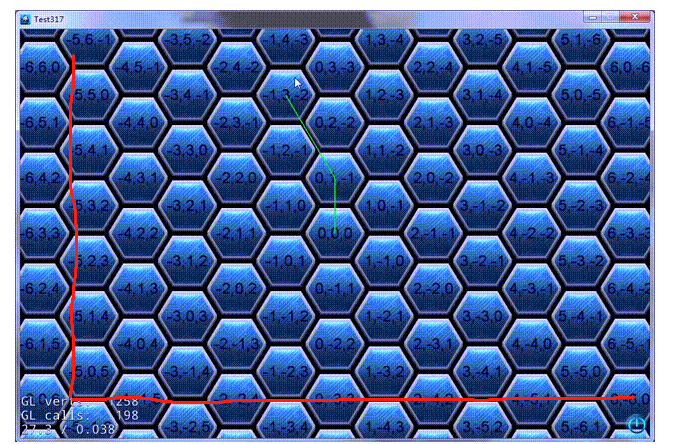
试试六边形
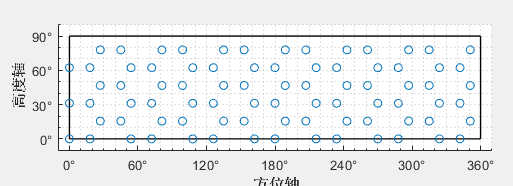
clear all; close all;clc; jiange = 18; ret = []; x = 0; y = 0; while x < 360 && y <= 90 if x >= 0 ret = [ret; x, y]; end x = x + jiange; if ( x >= 360 ) x = x - 360 -jiange/2.0; y = y + jiange/2.0*sqrt(3); end end ret1 = []; fori = 1 : 120 if ret(i,2) > 31 && ret(i,2) < 32 ifmod(i, 3) ~= 1 ret1 = [ret1;ret(i,:)]; end elseif ret(i,2) < 31 ifmod(i, 3) ~= 0 ret1 = [ret1;ret(i,:)]; end elseif ret(i,2) > 60 ifmod(i, 3) ~= 2 ret1 = [ret1;ret(i,:)]; end elseif ret(i,2) > 32 ifmod(i, 3) ~= 1 ret1 = [ret1;ret(i,:)]; end end end % for i = 1 : 120 % if mod(i, 3) ~= 0 % ret1 = [ret1;ret(i,:)]; % end % % end
clear all; close all;clc; jiange = 22.5; ret = []; x = 0; y = 0; while x < 360 && y <= 90 if x >= 0 ret = [ret; x, y]; end x = x + jiange; if ( x >= 360 ) x = x - 360 -jiange/2.0; y = y + jiange/2.0*sqrt(3); end end ret1 = []; fori = 1 : 80 if ret(i,2) < 3 ifmod(i, 3) ~= 0 ret1 = [ret1;ret(i,:)]; end elseif ret(i,2) > 19 && ret(i,2) < 20 ifmod(i, 3) ~= 2 ret1 = [ret1;ret(i,:)]; end elseif ret(i,2) < 39 ifmod(i, 3) ~= 2 ret1 = [ret1;ret(i,:)]; end elseif ret(i,2) > 60 ifmod(i, 3) ~= 1 ret1 = [ret1;ret(i,:)]; end elseif ret(i,2) > 32 ifmod(i, 3) ~= 1 ret1 = [ret1;ret(i,:)]; end end end
jiange = 30; ret = []; x = 0; y = 0; while x < 360 && y <= 90 if x >= 0 ret = [ret; x, y]; end x = x + jiange; if ( x >= 360 ) x = x - 360 -jiange/2.0; y = y + jiange/2.0*sqrt(3); end end ret2 = []; fori = 1 : 48 if ret(i,2) < 3 ifmod(i, 3) ~= 0 ret2 = [ret2;ret(i,:)]; end elseif ret(i,2) < 39 ifmod(i, 3) ~= 1 ret2 = [ret2;ret(i,:)]; end elseif ret(i,2) < 60 ifmod(i, 3) ~= 0 ret2 = [ret2;ret(i,:)]; end else ifmod(i, 3) ~= 1 ret2 = [ret2;ret(i,:)]; end end end
81个点 17.6717
随机点
tic ret = []; sum = 0; len = 100000; fori = 1 : len x = 360.*rand(48, 1); y = 90.*rand(48, 1); sum = sum + Copy_3_of_totalH([x,y]); end av = sum / len toc
随机加扰动
tic % ret = []; sum = 0; len = 100000; len1 = 48; minv = 60; maxv = 0; fori = 1 : len ret1 = ret; ret1 = ret1 + 5*rand(len1,2)-2.5; tmp = Copy_3_of_totalH(ret1); minv = min(minv, tmp); maxv = max(maxv, tmp); sum = sum + tmp; end av = sum / len toc
随机加点
tic jiange = 22.5; ret = []; x = 0; y = 0; while x < 360 && y <= 90 ret = [ret; x, y]; y = y + jiange; if ( y > 90 ) y = 0; x = x + jiange; end end
sum = 0; len = 100000; minv = 60; maxv = 0; fori = 1 : len ret1 = ret; x = 360 * rand; y = 90 * rand; ret1 = [ret1;x,y]; tmp = Copy_3_of_totalH(ret1); minv = min(minv, tmp); maxv = max(maxv, tmp); sum = sum + tmp; end av = sum / len toc
画图 随机扰动
hold on; plot([48,80,120],[13.7714,13.7110,13.6724],'-ksquare') hold on plot([48,80,120],[13.7436,13.6732,13.6244],'-o','Color',[00.60.1]) hold on plot([48,80,120],[13.6305,13.5185,13.4272],'-^','Color',[0.500.8]) hold on %% xlim([43, 125]) line([48-1.000,48+1.000],[13.7311,13.7311],'Color',[00.60.1],'linewidth',1); hold on; line([48-1.000,48+1.000],[13.7549,13.7549],'color',[00.60.1],'linewidth',1); hold on; line([48,48],[13.7311,13.7549],'color',[00.60.1],'linewidth',1);
line([80-1.000,80+1.000],[13.6591,13.6591],'color',[00.60.1],'linewidth',1); hold on; line([80-1.000,80+1.000],[13.6844,13.6844],'color',[00.60.1],'linewidth',1); hold on; line([80,80],[13.6844,13.6591],'color',[00.60.1],'linewidth',1);
line([120-1.000,120+1.000],[13.6115,13.6115],'color',[00.60.1],'linewidth',1); hold on; line([120-1.000,120+1.000],[13.6364,13.6364],'color',[00.60.1],'linewidth',1); hold on; line([120,120],[13.6115,13.6364],'color',[00.60.1],'linewidth',1);
%% line([48-1.000,48+1.000],[13.5590,13.5590],'color',[0.500.8],'linewidth',1); hold on; line([48-1.000,48+1.000],[13.6914,13.6914],'color',[0.500.8],'linewidth',1); hold on; line([48,48],[13.6914,13.5590],'color',[0.500.8],'linewidth',1);
line([80-1.000,80+1.000],[13.4549,13.4549],'color',[0.500.8],'linewidth',1); hold on; line([80-1.000,80+1.000],[13.5855,13.5855],'color',[0.500.8],'linewidth',1); hold on; line([80,80],[13.5855,13.4549],'color',[0.500.8],'linewidth',1);
line([120-1.000,120+1.000],[13.3566,13.3566],'color',[0.500.8],'linewidth',1); hold on; line([120-1.000,120+1.000],[13.4927,13.4927],'color',[0.500.8],'linewidth',1); hold on; line([120,120],[13.3566,13.4927],'color',[0.500.8],'linewidth',1);
hold on; plot([48,80,120],[13.7714,13.7110,13.6724],'-ksquare') hold on plot([48,80,120],[13.7501,13.6984,13.6639],'-o','Color',[00.60.1]) hold on plot([48,80,120],[13.6847,13.6586,13.6372],'-^','Color',[0.500.8]) hold on %% xlim([43, 125]) line([48-1.000,48+1.000],[13.1914,13.1914],'Color',[00.60.1],'linewidth',1); hold on; line([48-1.000,48+1.000],[13.7214,13.7214],'color',[00.60.1],'linewidth',1); hold on; line([48,48],[13.1914,13.7214],'color',[00.60.1],'linewidth',1);
line([80-1.000,80+1.000],[13.3497,13.3497],'color',[00.60.1],'linewidth',1); hold on; line([80-1.000,80+1.000],[13.6806,13.6806],'color',[00.60.1],'linewidth',1); hold on; line([80,80],[13.3497,13.6806],'color',[00.60.1],'linewidth',1);
line([120-1.000,120+1.000],[13.4646,13.4646],'color',[00.60.1],'linewidth',1); hold on; line([120-1.000,120+1.000],[13.6520,13.6520],'color',[00.60.1],'linewidth',1); hold on; line([120,120],[13.4646,13.6520],'color',[00.60.1],'linewidth',1);
hold on; plot([48,80,120],[13.7714,13.7110,13.6724],'-ksquare') hold on plot([48,80,120],[13.6630,13.6456,13.6286],'-v','Color',[0.60.10.1]) hold on
%% line([48-1.000,48+1.000],[13.1646,13.1646],'Color',[0.60.10.1],'linewidth',1); hold on; line([48-1.000,48+1.000],[13.7697,13.7697],'color',[0.60.10.1],'linewidth',1); hold on; line([48,48],[13.1646,13.7697],'color',[0.60.10.1],'linewidth',1);
line([80-1.000,80+1.000],[13.3706,13.3706],'color',[0.60.10.1],'linewidth',1); hold on; line([80-1.000,80+1.000],[13.7095,13.7095],'color',[0.60.10.1],'linewidth',1); hold on; line([80,80],[13.3706,13.7095],'color',[0.60.10.1],'linewidth',1);
line([120-1.000,120+1.000],[13.4553,13.4553],'color',[0.60.10.1],'linewidth',1); hold on; line([120-1.000,120+1.000],[13.6715,13.6715],'color',[0.60.10.1],'linewidth',1); hold on; line([120,120],[13.4553,13.6715],'color',[0.60.10.1],'linewidth',1);
clear all; close all;clc;tic; jiange = 22.5; ret = []; x = 0; y = 0; while x < 360 && y <= 90 ret = [ret; x, y]; y = y + jiange; if ( y > 90 ) y = 0; x = x + jiange; end end ret(end,:)=[];
sum = 0; len = 100000; minv = 60; maxv = 0; fori = 1 : len ret1 = ret; x = 360 * rand; y = 90 * rand; ret1 = [ret1;x,y]; tmp = Copy_3_of_totalH(ret1); minv = min(minv, tmp); if ( tmp > maxv ) maxv = tmp; x y end
sum = sum + tmp; end av = sum / len toc
我本章的实验基于的是同n值的,因为n值大,KL熵小 ,不同n值不能说明均匀性。
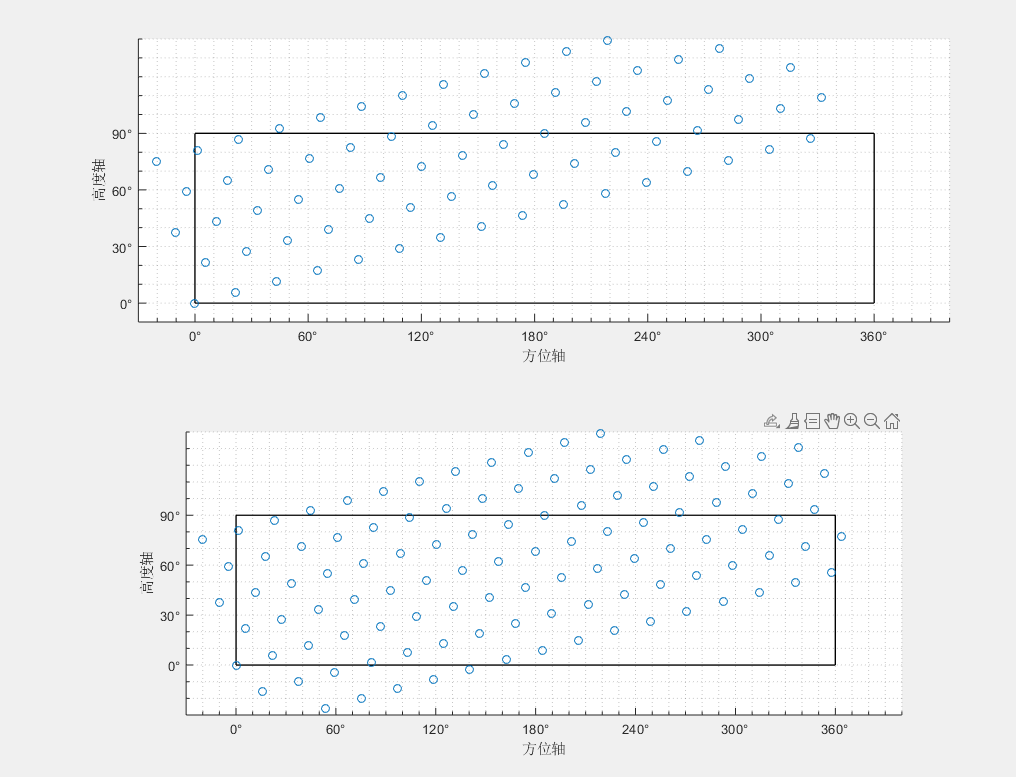
正三角形网格点旋转
clear all; close all;clc; jiange = 22.5; rec = []; x = 0; y = 0; while x < 360 && y <= 90 if x >= 0 rec = [rec; x, y]; end x = x + jiange; if ( x >= 360 ) x = x - 360 -jiange/2.0; y = y + jiange/2.0*sqrt(3); end end d = 15; rec1(:,1) = rec(:,1)*cosd(d) - rec(:,2)*sind(d); rec1(:,2) = rec(:,1)*sind(d) + rec(:,2)*cosd(d);
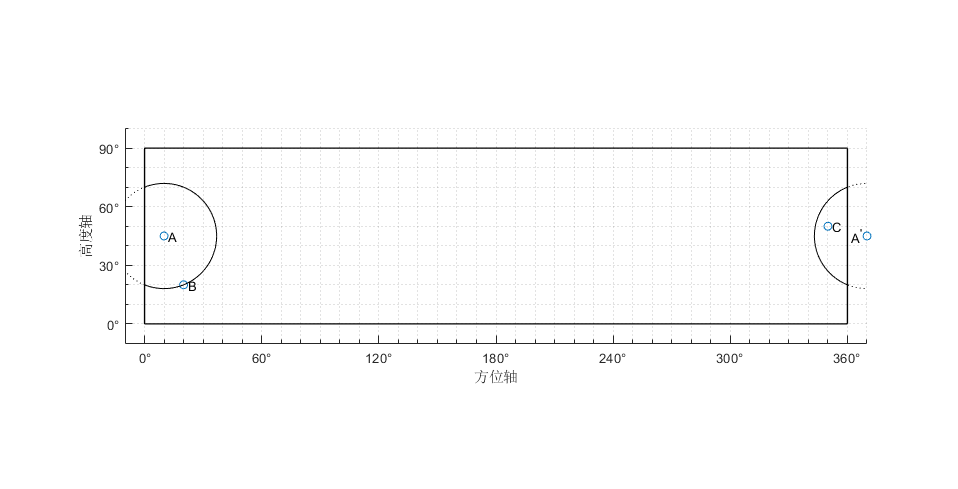
subplot(2,1,1) axis equal; xticks([060120180240300360]) yticks([0306090]) xlim([-30400]); ylim([-30140]); ax = gca; ax.XAxis.MinorTick = 'on'; ax.XAxis.MinorTickValues = ax.XAxis.Limits(1):10:ax.XAxis.Limits(2); ax.YAxis.MinorTick = 'on'; ax.YAxis.MinorTickValues = ax.YAxis.Limits(1):10:ax.YAxis.Limits(2); grid minor; hold on; xt=get(gca,'xtick'); for k=1:numel(xt); xt1{k}=sprintf('%d°',xt(k)); end set(gca,'xticklabel',xt1); yt=get(gca,'ytick'); for k=1:numel(yt); yt1{k}=sprintf('%d°',yt(k)); end set(gca,'yticklabel',yt1); xlabel('方位轴'); ylabel('高度轴'); line([0,360],[90,90],'color','k','linewidth',1); line([0,0],[0,90],'color','k','linewidth',1); line([0,360],[0,0],'color','k','linewidth',1); line([360,360],[0,90],'color','k','linewidth',1); scatter(rec1(:,1), rec1(:,2))
jiange = 22.5; rec2 = []; x = 0; y = -jiange *sqrt(3) ; while x <= 360+jiange && y <= 90 if x >= 0 rec2 = [rec2; x, y]; end x = x + jiange; if ( x >= 360+jiange ) x = x-360 -jiange/2.0 - jiange; y = y + jiange/2.0*sqrt(3); end end d = 15; rec3(:,1) = rec2(:,1)*cosd(d) - rec2(:,2)*sind(d); rec3(:,2) = rec2(:,1)*sind(d) + rec2(:,2)*cosd(d);
xt=get(gca,'xtick'); for k=1:numel(xt); xt1{k}=sprintf('%d°',xt(k)); end set(gca,'xticklabel',xt1); yt=get(gca,'ytick'); for k=1:numel(yt); yt1{k}=sprintf('%d°',yt(k)); end set(gca,'yticklabel',yt1);
clear all; close all;clc; jiange = 22.5; ret = []; x = 0; y = 0; while x < 360 && y <= 90 if x >= 0 ret = [ret; x, y]; end x = x + jiange; if ( x >= 360 ) x = x - 360 -jiange/2.0; y = y + jiange/2.0*sqrt(3); end end
xt=get(gca,'xtick'); for k=1:numel(xt); xt1{k}=sprintf('%d°',xt(k)); end set(gca,'xticklabel',xt1); yt=get(gca,'ytick'); for k=1:numel(yt); yt1{k}=sprintf('%d°',yt(k)); end set(gca,'yticklabel',yt1);
clear all; close all;clc; tic; M = csvread('J2000_5_hor.csv'); points = M(:, 2:4);
jiange = 360.0/9; ret = []; x = 0; y = 0; while x < 360 && y <= 90 if x >= -0.001 ret = [ret; x, y]; end x = x + jiange; if ( x >= 359 ) x = x - 360 -jiange/2.0; y = y + jiange/2.0*sqrt(3); end end
n = length(ret); tmp = ones(n,1)*360; rev = ones(n,2)*0;
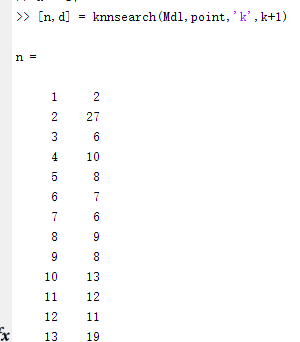
Mdl = KDTreeSearcher(ret); kk = 0; fori = 1 : length(points) [nn,d] = knnsearch(Mdl,points(i,1:2),'k',kk+1); if d < tmp(nn) tmp(nn) = d; rev(nn,:) = points(i,1:2); end end
xt=get(gca,'xtick'); for k=1:numel(xt); xt1{k}=sprintf('%d°',xt(k)); end set(gca,'xticklabel',xt1); yt=get(gca,'ytick'); for k=1:numel(yt); yt1{k}=sprintf('%d°',yt(k)); end set(gca,'yticklabel',yt1);
Mdl = KDTreeSearcher(ret); kk = 0; fori = 1 : length(points) [nn,d] = knnsearch(Mdl,points(i,1:2),'k',kk+1); value = -d - points(i,3); if value > tmp(nn) tmp(nn) = value; rev(nn,:) = points(i,1:2); end end
toc; Copy_3_of_totalH(rev)
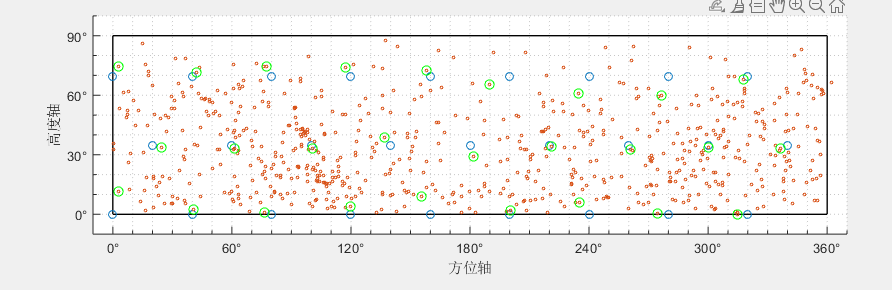
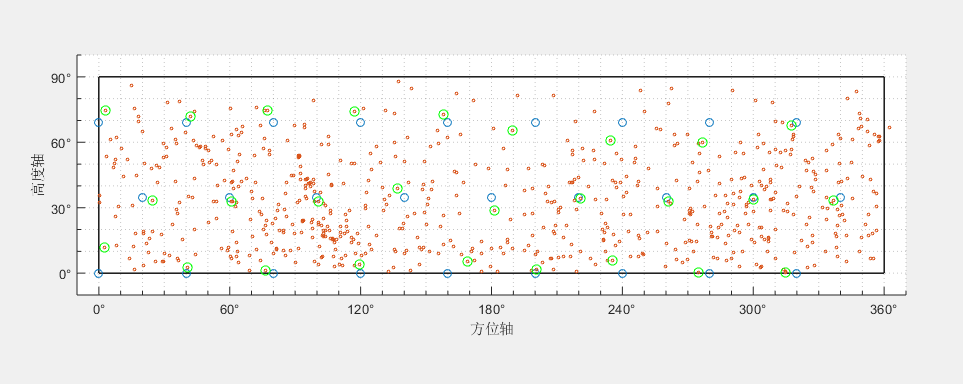
clear all; close all;clc; tic; M = csvread('J2000_5_hor.csv'); points = M(:, 2:4); jiange = 360.0/10; ret = []; x = 0; y = 0; while x < 360 && y <= 90 if x >= -0.0000001 ret = [ret; x, y]; end x = x + jiange; if ( x >= 359.9999999 ) x = x - 360 -jiange/2.0; y = y + jiange/2.0*sqrt(3); end end
% fx = f(xx(:,1),xx(:,2)); % 代入x中的二维数据,算出个体当前适应度,为500行1列的数据
fori = 1:N %对每一个个体做判断 ret1 = ret + xx(i,:); ret1(ret1(:,1) > 360) = ret1(ret1(:,1) > 360) - 360; Mdl = KDTreeSearcher(ret1); tmp = ones(n,1)*(-500); rev = ones(n,2)*(0); for ii = 1 : length(points) [nn,ddd] = knnsearch(Mdl,points(ii,1:2),'k',kk+1); value = -ddd - points(ii,3); if value > tmp(nn) tmp(nn) = value; rev(nn,:) = points(ii,1:2); end end fx(i) = sum(tmp);
if fxm(i) < fx(i) %如果每个个体的历史最佳适应度小于个体当前适应度 fxm(i) = fx(i); % 更新个体历史最佳适应度,第一轮就是把小于零的清除 xm(i,:) = xx(i,:); % 更新个体历史最佳位置 end end
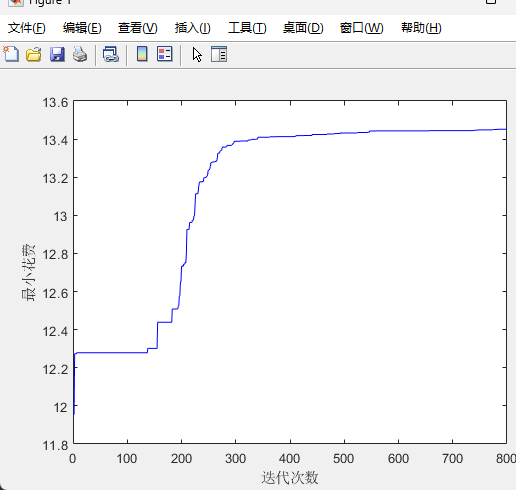
if fym < max(fxm) %种群历史最佳适应度小于个体里面最佳适应度的最大值 [fym, nmax] = max(fxm); % 更新群体历史最佳适应度,取出最大适应度的值和所在行数即位置 ym = xm(nmax, :); % 更新群体历史最佳位置 end v = v * w + c1 * rand *(xm - xx) + c2 * rand *(repmat(ym, N, 1) - xx); % 速度更新公式,repmat函数把ym矩阵扩充成N行1列 %%边界速度处理 fori=1:d forj=1:N if v(j,i)>vlimit(i,2); %如果速度大于边界速度,则把速度拉回边界 v(j,i)=vlimit(i,2); end if v(j,i) < vlimit(i,1) %如果速度小于边界速度,则把速度拉回边界 v(j,i)=vlimit(i,1); end end end xx = xx + v; % 位置更新 fori=1:d forj=1:N if xx(j,i)>plimit(i,2) xx(j,i)=plimit(i,2); end if xx(j,i) < plimit(i,1) xx(j,i)=plimit(i,1); end end end record(iter) = fym; %记录最大值 % if times >= 10 % cla; %清除轴线图形 % mesh(x0_1, x0_2, y0); % plot3(x(:,1),x(:,2),f(x(:,1),x(:,2)), 'ro');title('状态位置变化'); % pause(0.5); % times=0; % end iter = iter+1; end
toc;
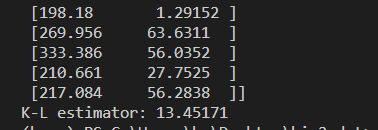
ret2 = ret + ym; ret2(ret2(:,1) > 360) = ret2(ret2(:,1) > 360) - 360; Mdl = KDTreeSearcher(ret2); tmp = ones(n,1)*(-500); rev = ones(n,2)*(0); for ii = 1 : length(points) [nn,ddd] = knnsearch(Mdl,points(ii,1:2),'k',kk+1); value = -ddd - points(ii,3); if value > tmp(nn) tmp(nn) = value; rev(nn,:) = points(ii,1:2); end end aaan = sum(tmp);
Copy_3_of_totalH(rev)
clf;
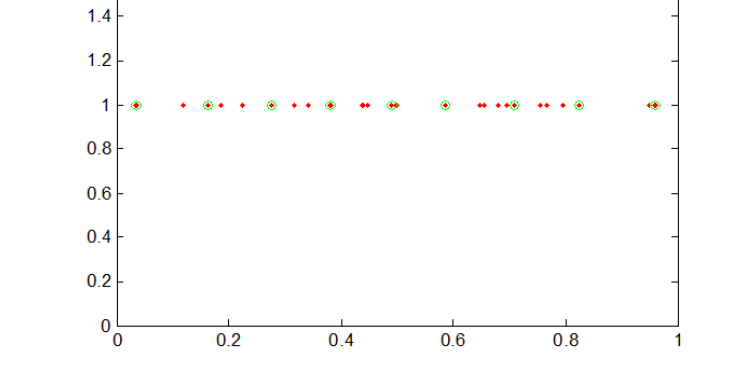
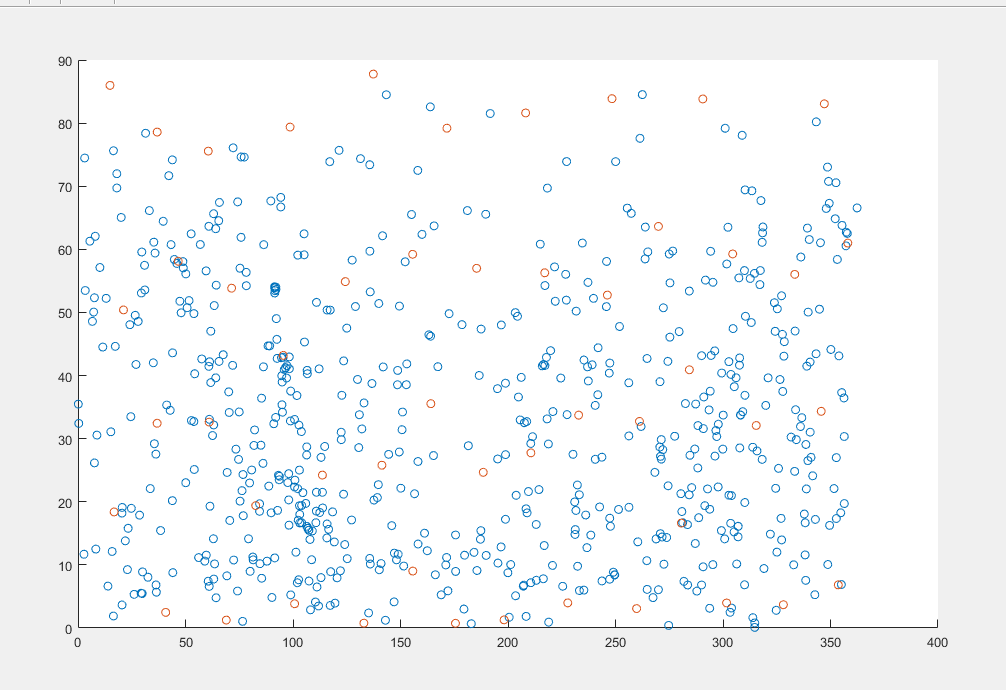
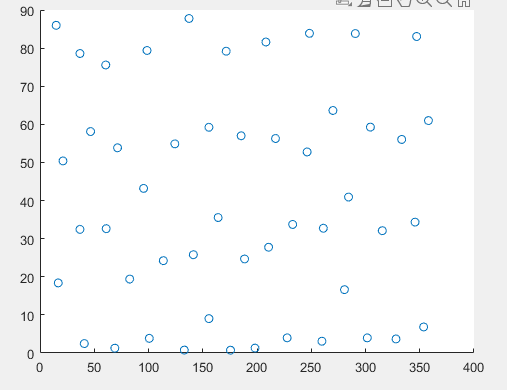
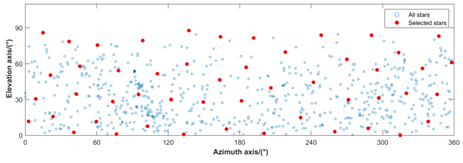
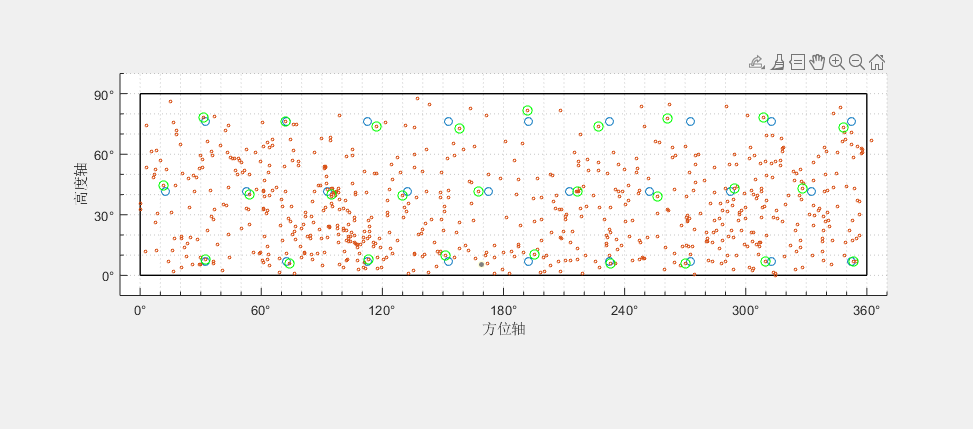
p1 = scatter(ret2(:,1), ret2(:,2)) hold on p2 = scatter(points(:,1), points(:,2),5) hold on p3 = scatter(rev(:,1), rev(:,2),50,'g') hold on
xt=get(gca,'xtick'); for k=1:numel(xt); xt1{k}=sprintf('%d°',xt(k)); end set(gca,'xticklabel',xt1); yt=get(gca,'ytick'); for k=1:numel(yt); yt1{k}=sprintf('%d°',yt(k)); end set(gca,'yticklabel',yt1);
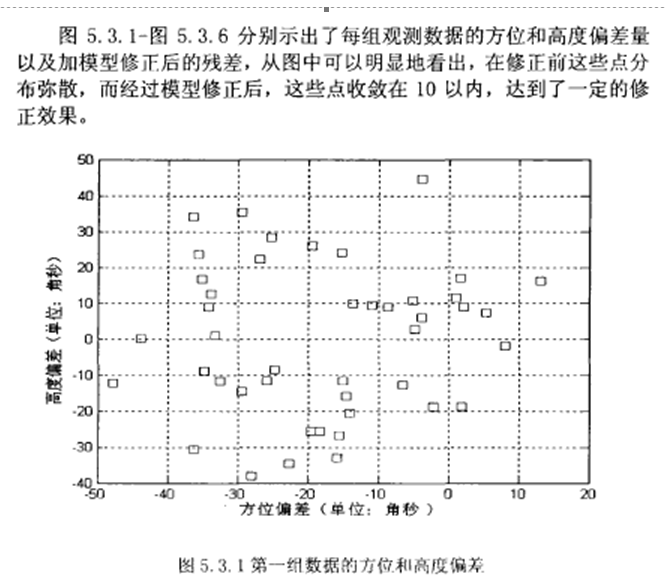
%Res 为方程系数 Y° = A(弧度) * Res -> Res = inv(A'*A)*A'*Y; %E 为残差 E = (A*Res - Y)*3600; E = E / 2.0; %MSE 为平均均方误差 RMS = sqrt(mse(E)) %输出 到TXT文件 科学计算法 %save ResultXISHU.txt Res -ascii; file1=fopen('ResultXISHU.txt','w'); fori=1:length(Res) fprintf(file1,'%5.5f\r\n',Res(i)); end EA = E(1:64); EE = E(65:end);
xt=get(gca,'xtick'); for k=1:numel(xt); xt1{k}=sprintf('%d°',xt(k)); end set(gca,'xticklabel',xt1); yt=get(gca,'ytick'); for k=1:numel(yt); yt1{k}=sprintf('%d°',yt(k)); end set(gca,'yticklabel',yt1);