clc;clear;close all;
index = [1670
1477
1502
1631
1603
1453
1432
1492
1488
1648
1646
1566
1688
1655
1505
];
load("附件2 简易星表.mat");
Attribute_Set = {'LineWidth',1.5};
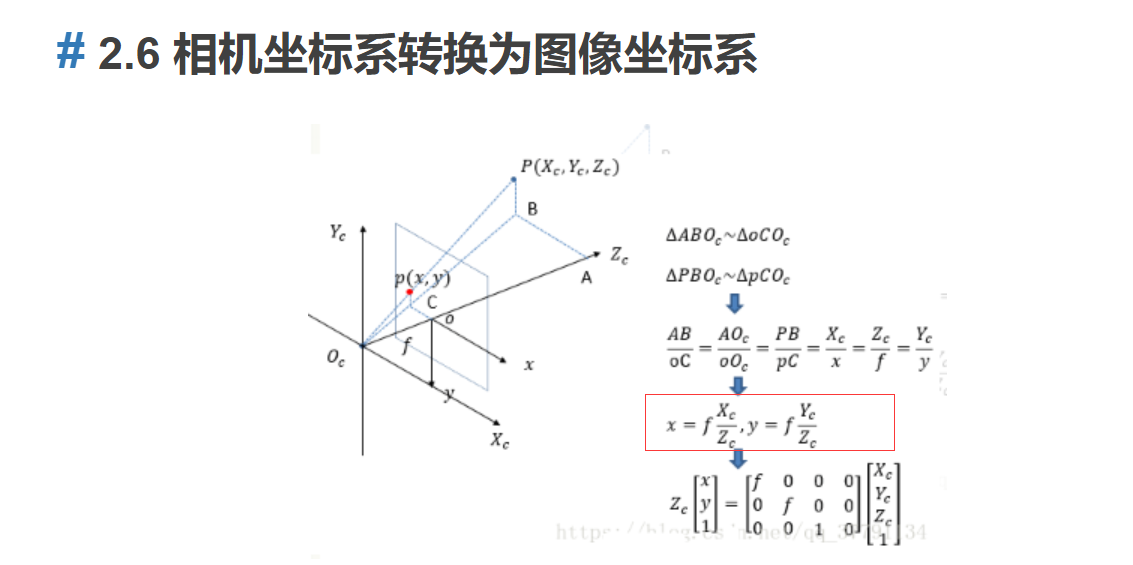
f = 256/(tand(6));
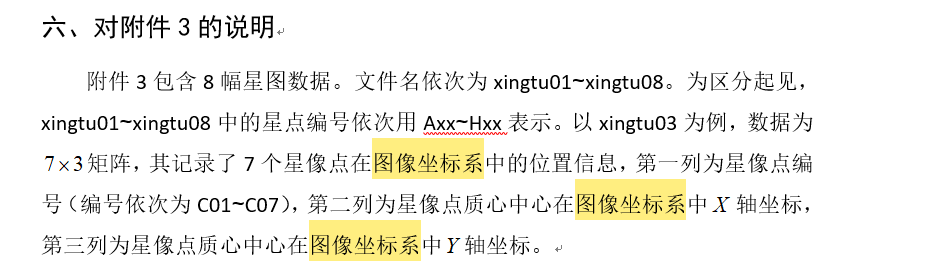
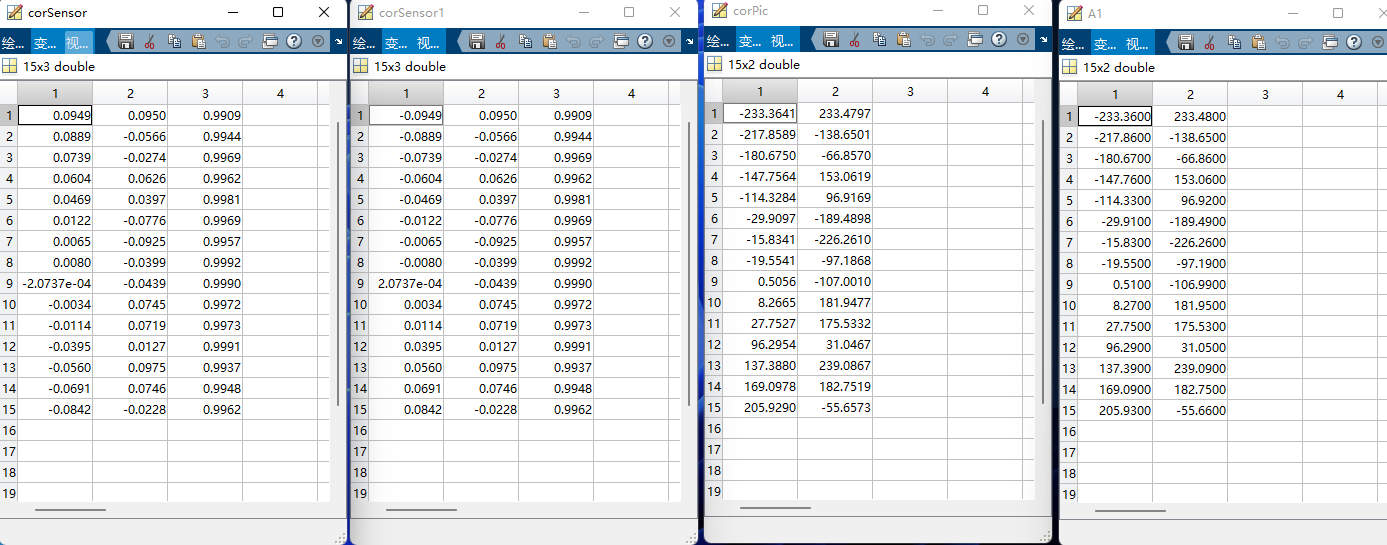
A1 = xlsread('D:\文献\starimage\npmcm2019b\npmcm2019-B\附件3 8幅星图相关数据\xingtu01.xls') - 256;
newMatrix= [A1,repmat(f,size(A1,1),1)];
for j = 1:size(newMatrix,1)
ll(j,1) = norm(newMatrix(j,:));
end
newNewMatrix = newMatrix./ll;
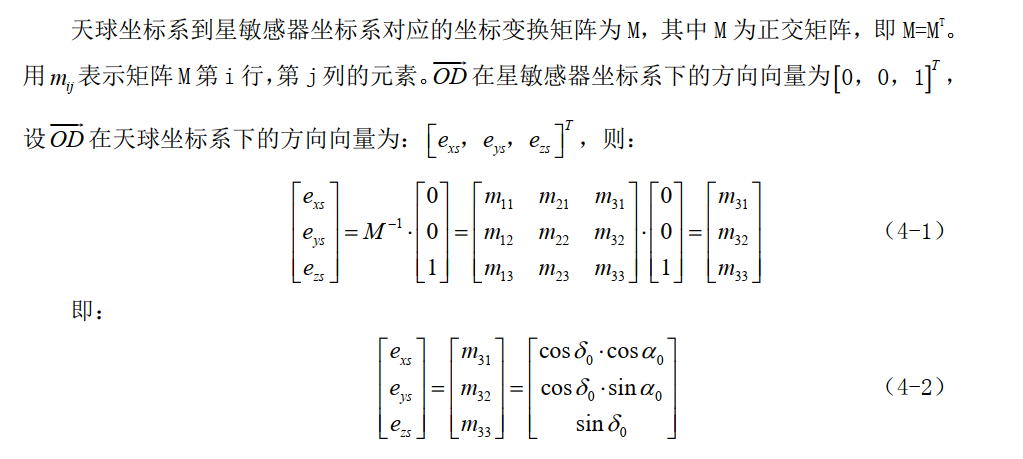
corWorld = [ cosd(star_data(index,3)).*cosd(star_data(index,2)) , cosd(star_data(index,3)).*sind(star_data(index,2)) , sind(star_data(index,3)) ];
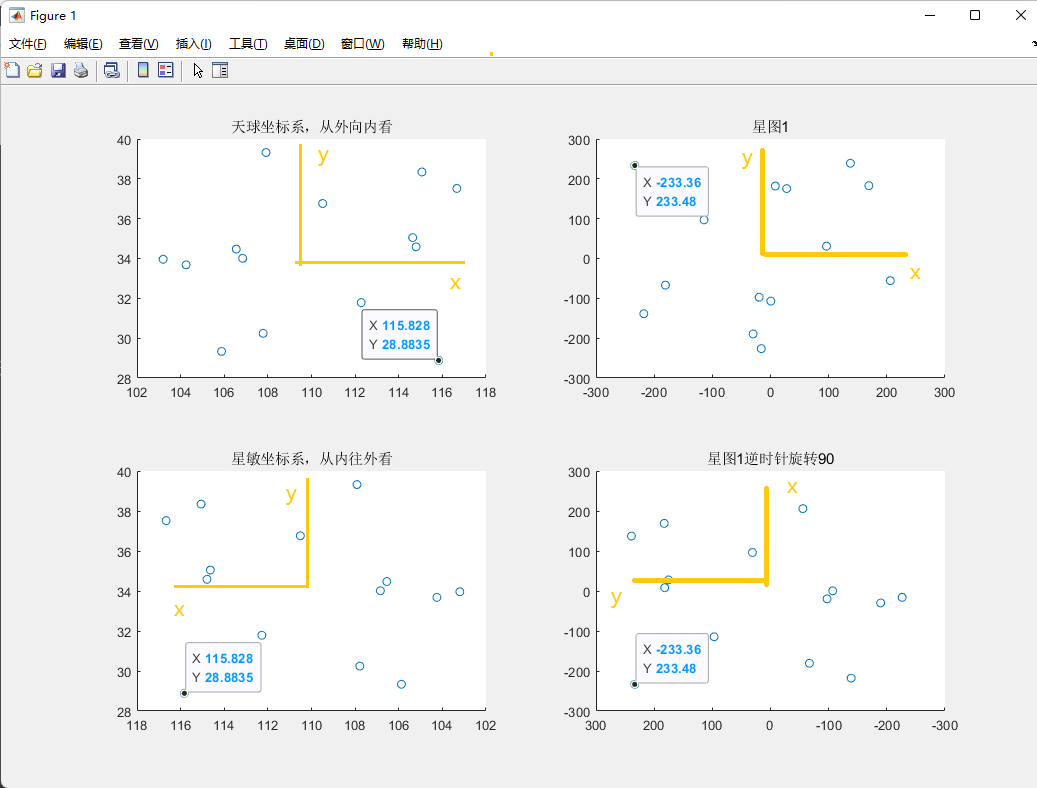
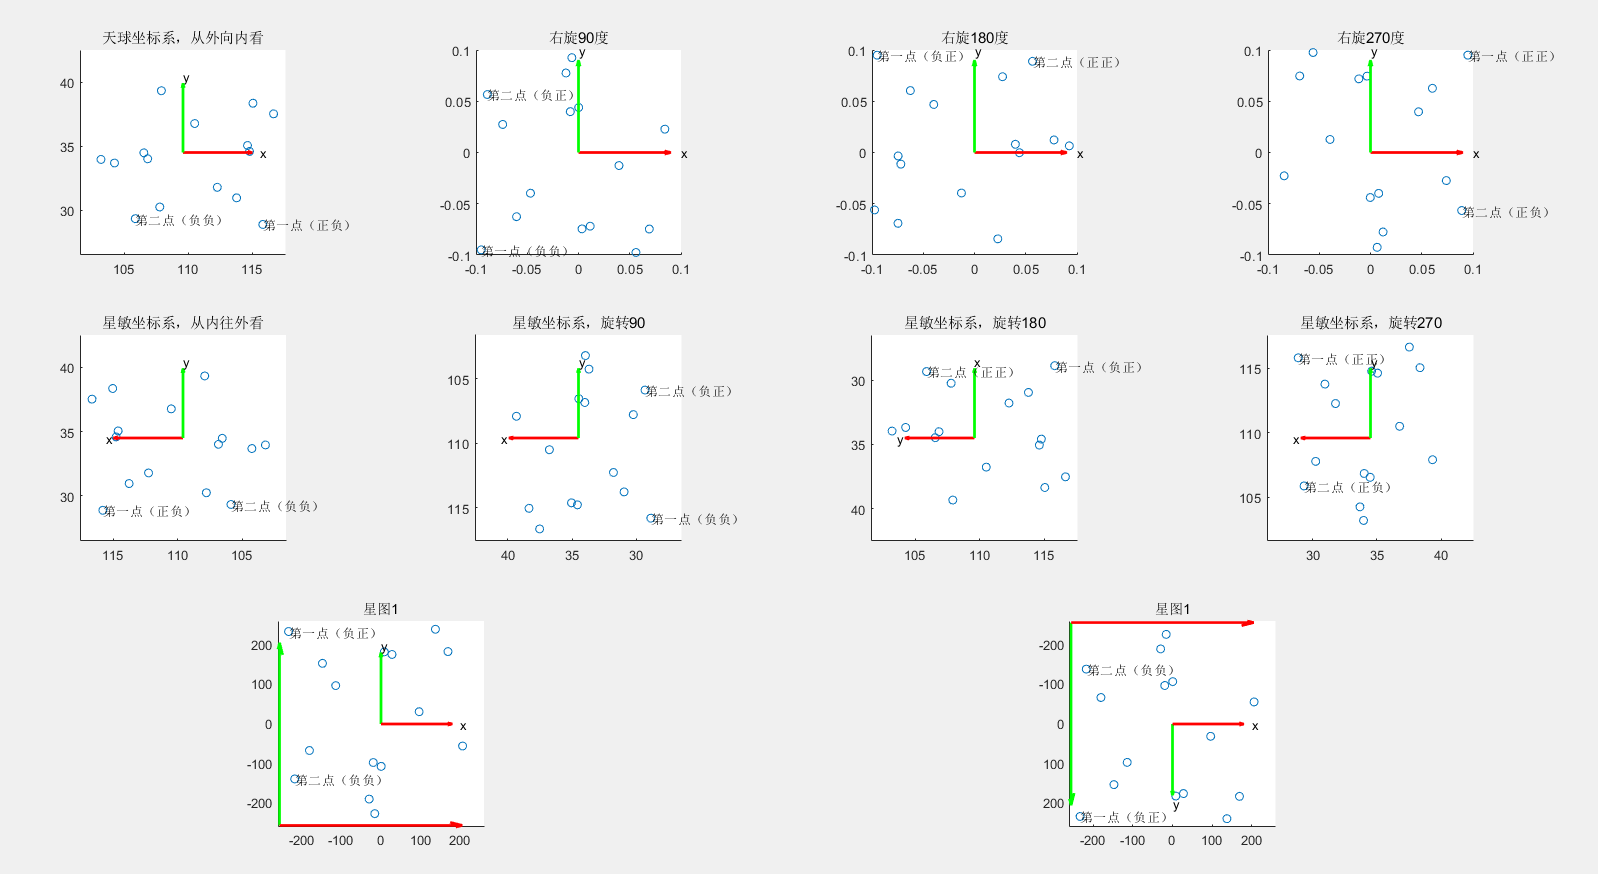
subplot(3,4,1);
scatter(star_data(index,2),star_data(index,3))
title('天球坐标系,从外向内看')
axis equal;hold on;
quiver(109.6,34.5,6,0,'LineWidth',2,'Color','r');
text(109.6+6,34.5,'x');
text(109.6,34.5+6,'y');
text(115.828,28.8835,'第一点(正负)');
text(105.88,29.33,'第二点(负负)');
quiver(109.6,34.5,0,6,'LineWidth',2,'Color','g');
xlim([109.6-8 109.6+8]);
ylim([34.5-8 34.5+8]);
subplot(3,4,5);
scatter(star_data(index,2),star_data(index,3))
set(gca,'XDir','reverse')
axis equal;hold on;
title('星敏坐标系,从内往外看')
quiver(109.6,34.5,6,0,'LineWidth',2,'Color','r');
quiver(109.6,34.5,0,6,'LineWidth',2,'Color','g');
text(109.6+6,34.5,'x');
text(109.6,34.5+6,'y');
text(115.828,28.8835,'第一点(正负)');
text(105.88,29.33,'第二点(负负)');
xlim([109.6-8 109.6+8]);
ylim([34.5-8 34.5+8]);
subplot(3,4,9);
scatter(star_data(index,2),star_data(index,3))
set(gca,'XDir','reverse')
axis equal;hold on;
title('上图旋转')
quiver(109.6,34.5,6,0,'LineWidth',2,'Color','r');
quiver(109.6,34.5,0,6,'LineWidth',2,'Color','g');
text(109.6+6,34.5,'x');
text(109.6,34.5+6,'y');
text(115.828,28.8835,'第一点(正负)');
text(105.88,29.33,'第二点(负负)');
xlim([109.6-8 109.6+8]);
ylim([34.5-8 34.5+8]);
view(180,90);
subplot(3,4,6);
scatter(star_data(index,2),star_data(index,3))
set(gca,'XDir','reverse')
axis equal;hold on;
title('星敏坐标系,旋转90')
quiver(109.6,34.5,0,6,'LineWidth',2,'Color','r');
quiver(109.6,34.5,-6,0,'LineWidth',2,'Color','g');
text(109.6-6,34.5,'y');
text(109.6,34.5+6,'x');
text(115.828,28.8835,'第一点(负负)');
text(105.88,29.33,'第二点(负正)');
xlim([109.6-8 109.6+8]);
ylim([34.5-8 34.5+8]);
view(-90,90);
subplot(3,4,7);
scatter(star_data(index,2),star_data(index,3))
set(gca,'XDir','reverse')
axis equal;hold on;
title('星敏坐标系,旋转180')
quiver(109.6,34.5,-6,0,'LineWidth',2,'Color','r');
quiver(109.6,34.5,0,-6,'LineWidth',2,'Color','g');
text(109.6-6,34.5,'y');
text(109.6,34.5-6,'x');
text(115.828,28.8835,'第一点(负正)');
text(105.88,29.33,'第二点(正正)');
xlim([109.6-8 109.6+8]);
ylim([34.5-8 34.5+8]);
view(180,90);
subplot(3,4,8);
scatter(star_data(index,2),star_data(index,3))
set(gca,'XDir','reverse')
axis equal;hold on;
title('星敏坐标系,旋转270')
quiver(109.6,34.5,0,-6,'LineWidth',2,'Color','r');
quiver(109.6,34.5,6,0,'LineWidth',2,'Color','g');
text(109.6+6,34.5,'y');
text(109.6,34.5-6,'x');
text(115.828,28.8835,'第一点(正正)');
text(105.88,29.33,'第二点(正负)');
xlim([109.6-8 109.6+8]);
ylim([34.5-8 34.5+8]);
view(90,90);
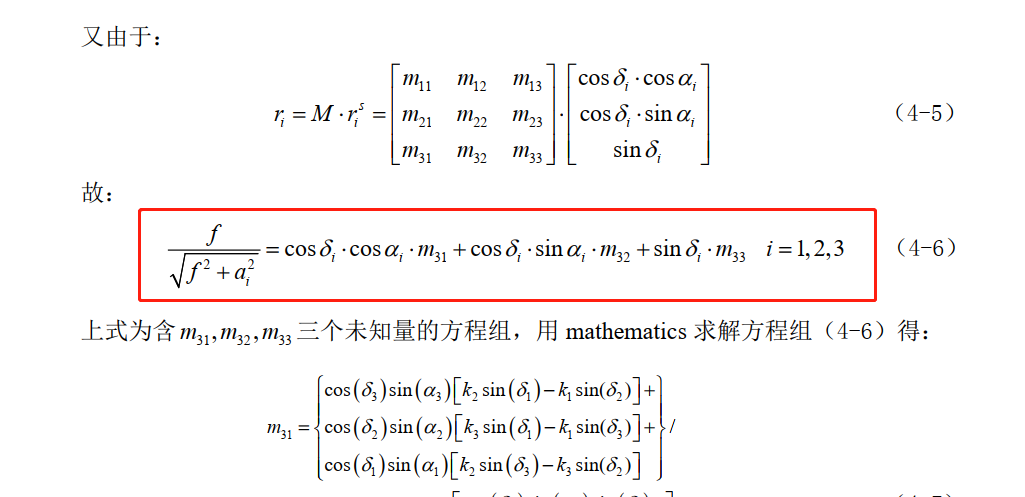
A = [ cosd(star_data(index,3)).*cosd(star_data(index,2)) , cosd(star_data(index,3)).*sind(star_data(index,2)) , sind(star_data(index,3)) ];
Y = [ (f ./ (sqrt(f^2 + newMatrix(1:15,1).^2 + newMatrix(1:15,2).^2)) )];
zhixiang = inv(A'*A)*A'*Y;
E = (A*zhixiang - Y);
RMS = sqrt(mse(E));
if zhixiang(2)/sqrt(1-zhixiang(3)^2) > 0
a=acosd( zhixiang(1) / sqrt(1-((zhixiang(3))^2) ) );
else
a = 360-acosd( zhixiang(1) / sqrt(1-((zhixiang(3))^2) ) );
end
b=asind( zhixiang(3) );
fai = 90;
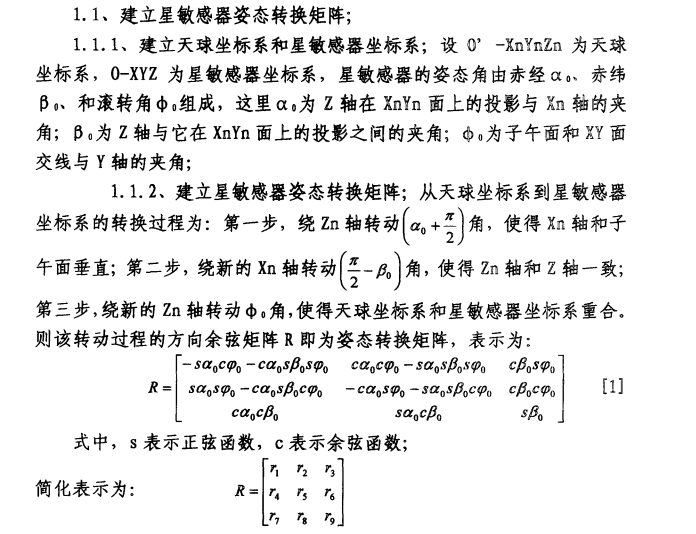
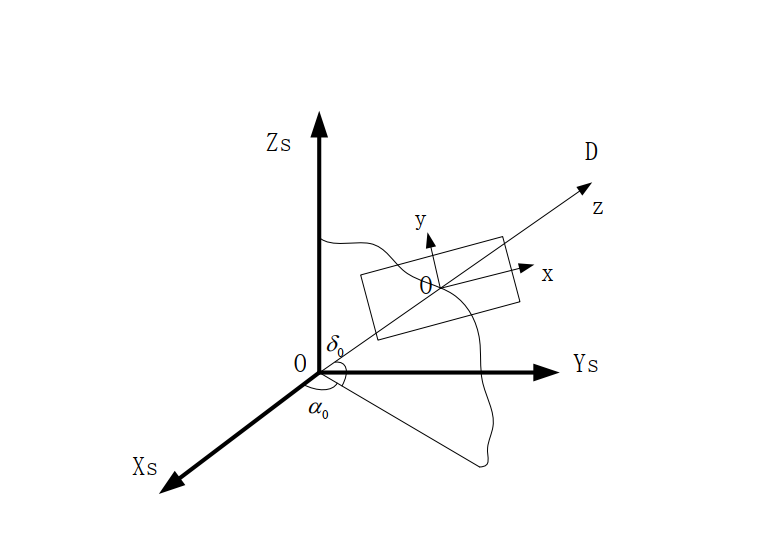
R = [
-sind(a)*cosd(fai)-cosd(a)*sind(b)*sind(fai) cosd(a)*cosd(fai)-sind(a)*sind(b)*sind(fai) cosd(b)*sind(fai)
sind(a)*sind(fai)-cosd(a)*sind(b)*cosd(fai) -cosd(a)*sind(fai)-sind(a)*sind(b)*cosd(fai) cosd(b)*cosd(fai)
cosd(a)*cosd(b) sind(a)*cosd(b) sind(b)
];
corSensor = corWorld * R';
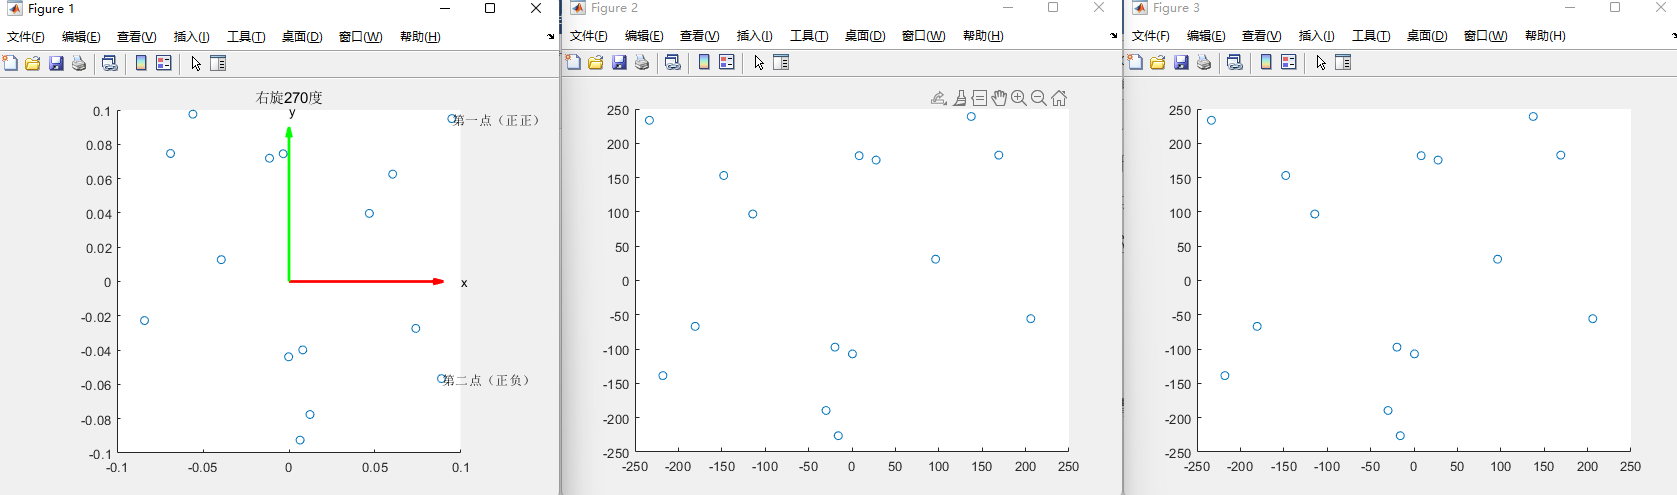
subplot(3,4,2);
scatter(corSensor(:,1),corSensor(:,2))
title('右旋90度')
axis equal;hold on;
xlim([-0.1 0.1]);
ylim([-0.1 0.1]);
quiver(0,0,0.1,0,'LineWidth',2,'Color','r');
quiver(0,0,0,0.1,'LineWidth',2,'Color','g');
text(0,0.1,'y');
text(0.1,0,'x');
text(corSensor(1,1),corSensor(1,2),'第一点(负负)');
text(corSensor(2,1),corSensor(2,2),'第二点(负正)');
fai = 180;
R = [
-sind(a)*cosd(fai)-cosd(a)*sind(b)*sind(fai) cosd(a)*cosd(fai)-sind(a)*sind(b)*sind(fai) cosd(b)*sind(fai)
sind(a)*sind(fai)-cosd(a)*sind(b)*cosd(fai) -cosd(a)*sind(fai)-sind(a)*sind(b)*cosd(fai) cosd(b)*cosd(fai)
cosd(a)*cosd(b) sind(a)*cosd(b) sind(b)
];
corSensor = corWorld * R';
subplot(3,4,3);
scatter(corSensor(:,1),corSensor(:,2))
title('右旋180度')
axis equal;hold on;
xlim([-0.1 0.1]);
ylim([-0.1 0.1]);
quiver(0,0,0.1,0,'LineWidth',2,'Color','r');
quiver(0,0,0,0.1,'LineWidth',2,'Color','g');
text(0,0.1,'y');
text(0.1,0,'x');
text(corSensor(1,1),corSensor(1,2),'第一点(负正)');
text(corSensor(2,1),corSensor(2,2),'第二点(正正)');
fai = 270;
R = [
-sind(a)*cosd(fai)-cosd(a)*sind(b)*sind(fai) cosd(a)*cosd(fai)-sind(a)*sind(b)*sind(fai) cosd(b)*sind(fai)
sind(a)*sind(fai)-cosd(a)*sind(b)*cosd(fai) -cosd(a)*sind(fai)-sind(a)*sind(b)*cosd(fai) cosd(b)*cosd(fai)
cosd(a)*cosd(b) sind(a)*cosd(b) sind(b)
];
corSensor = corWorld * R';
subplot(3,4,4);
scatter(corSensor(:,1),corSensor(:,2))
title('右旋270度')
axis equal;hold on;
xlim([-0.1 0.1]);
ylim([-0.1 0.1]);
quiver(0,0,0.1,0,'LineWidth',2,'Color','r');
quiver(0,0,0,0.1,'LineWidth',2,'Color','g');
text(0,0.1,'y');
text(0.1,0,'x');
text(corSensor(1,1),corSensor(1,2),'第一点(正正)');
text(corSensor(2,1),corSensor(2,2),'第二点(正负)');
subplot(3,4,[9,10]);
scatter(A1(:,1),A1(:,2))
title('星图1')
axis equal;hold on;
quiver(0,0,0,200,'LineWidth',2,'Color','g');
quiver(-256,-256,0,512,'LineWidth',2,'Color','g');
quiver(0,0,200,0,'LineWidth',2,'Color','r');
quiver(-256,-256,512,0,'LineWidth',2,'Color','r');
text(200,0,'x');
text(0,200,'y');
text(-233,233,'第一点(负正)');
text(-217,-138,'第二点(负负)');
xlim([-260 260]);
ylim([-260 260]);
subplot(3,4,[11,12]);
scatter(A1(:,1),A1(:,2))
set(gca,'YDir','reverse')
title('星图1')
axis equal;hold on;
quiver(0,0,0,200,'LineWidth',2,'Color','g');
quiver(-256,-256,0,512,'LineWidth',2,'Color','g');
quiver(0,0,200,0,'LineWidth',2,'Color','r');
quiver(-256,-256,512,0,'LineWidth',2,'Color','r');
text(200,0,'x');
text(0,200,'y');
text(-233,233,'第一点(负正)');
text(-217,-138,'第二点(负负)');
xlim([-260 260]);
ylim([-260 260]);
|